Variable weather conditions throughout the U19 and U23 World Rowing Championships in Varese, Italy (even within a single day) makes it difficult to compare the absolute rowing speeds across different categories. The average winners’ speed in 12 comparable Olympic boat types (except lightweights) was slower for the U23s in Saturday’s finals (5.02m/s, 96.2% of World Best Time [WBT]) compared to the U19s on Sunday (5.07m/s, 99.2% of WBT), when four World Best Times were set in the JM8+, JW2x, JW4- and JW8+.
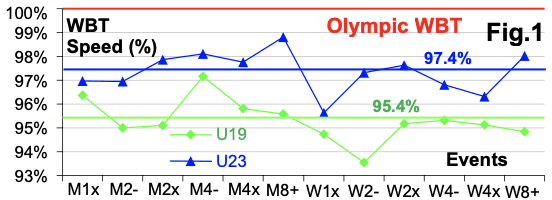
Due to differing weather conditions, it does not make sense to compare these results with those of the Tokyo Olympics, but it would be interesting to compare the WBTs in each category (Fig.1). I previously ran this type of analysis in 2009, and now, found this year’s values to be significantly higher: 95.4% in U19 (was 94.9% in 2009, +0.5% on average in 11 boats, excluding the recently introduced W4-), and 97.5% in U23 (was 96.5%, +1.0%). This means that the rowing speed of younger rowers is growing faster than in the Olympic category and margins between them are getting smaller.
The average stroke rate in 10 Olympic boats (Fig.2, exclusing M2x and M4- in Tokyo-2021) was the highest for Olympic rowers (38.9spm), lower for U23 (37.3, -1.6spm) and the lowest for U19 (36.6, -2.3spm). However, the winners and silver medallists in the U19s and U23s used nearly the same stroke rate.
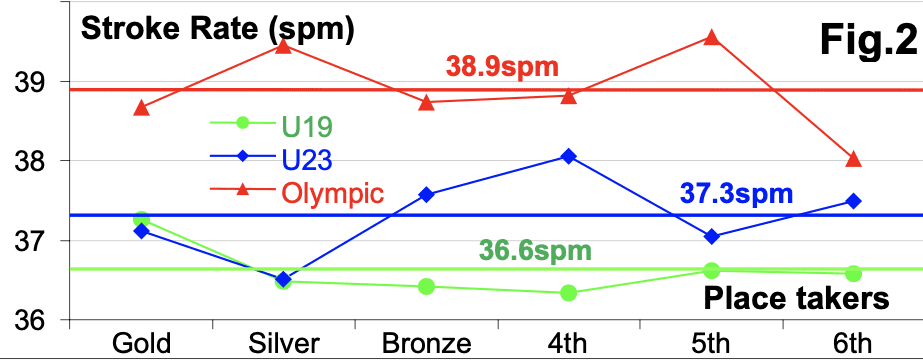
Fig.3 shows the average stroke rate of the A-finalists in 10 boat types across U19, U23 and Olympic categories:
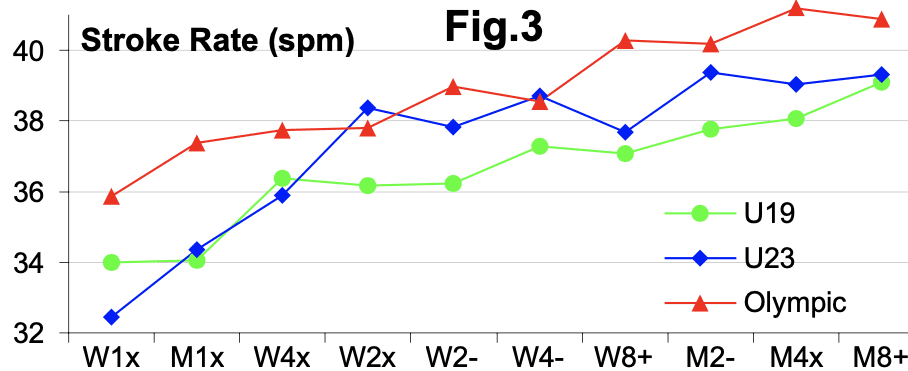
In U19s and Olympic categories, the stroke rate continuously grew from slower to faster boats, but in U23s some exceptionally high stroke rates were found in W2x, W4- and M2-. In W1x, M1x, W4x and M8+, U19 rowers used similar or even higher stroke rates compared to the same U23 categories. Compared to Olympic rowers, the average stroke rate was 94.2% in U19 (-5.8%) and 95.9% in U23 (-4.1%).
To analyse Effective Work per Stroke [EWpS] in various categories, the following method was used. Rowing power [P] can be expressed as:
P = DF v3 = EWpS / T = EWpS R / 60 (1)
Where DF is the drag factor, v is rowing speed, T is cycle time, R is stroke rate. Assuming DF the same, ratio of EWpSi to the target EWpST (Olympic rowers in this case) could be expressed as:
EWpSi / EWpST = (RT /Ri) (vi3 / vT3) (2)
Ratio of EWpS in younger rowers to Olympians in each boat type was derived using their WBTs and average stroke rate of the finalists A (Fig.4):
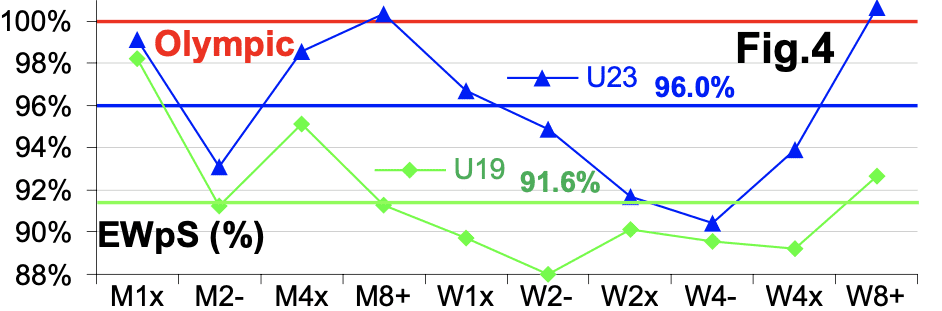
It is interesting that in both M8+ and W8+, EWpS in U23 rowers even exceeds that of Olympic rowers, and in M1x and M4x it gets very close. On average in 10 boat types, EWpS in U19s was 91.6% (-8.4%) and in U23s 96.0% (-4.0%) of the Olympic rowers. Comparing these values alongside stroke rate, it was found that the increase in rowing speed from younger rowers to Olympic level happens by gain in both racing Stroke Rate and Work per Stroke. Both components increased similarly by about 4% on the U23-Olympic jump, but on U19-U23 jump, the increase in Work per Stroke 4.4% was significantly higher than the increase in the Stroke Rate 1.7% (except M1x and M4x).
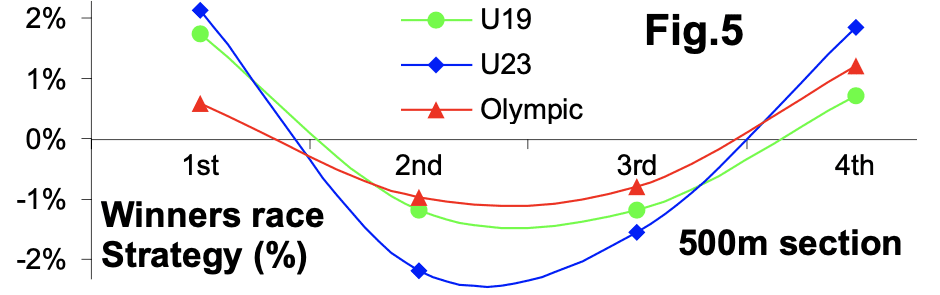
By comparing the average race strategy of the winners across the 12 comparable events (Fig.5), it was found that Olympic rowers had the most even distribution of their efforts during the race (SD=1.1%) with the relatively slowest start 500m section. Surprisingly, U19 rowers were the second most evenly distributed (SD=1.5%), with the U23 crews showed the most variable speed (SD=2.2%) with relatively faster start and finish 500m sections.